- Published on
Monitoring with Datadog in Apache APISIX


As the complexity of IT products and consumer-facing application development increases, monitoring becomes an integral part of any application delivery. Additionally, to meet the endless demand of rapid upgrade cycles while ensuring stability, streamlined performance and keeping a perfect balance between SLIs with SLOs and SLAs - effective monitoring is immensely important.
Apache APISIX decouples observability concerns from the application, which gives the developers an advantage of building applications focussing just only on the business logic when APISIX will take care of observability for the platform of their choice. This article talks about the recent addition of a new plugin datadog, and gives detailed instructions on how to integrate Datadog, which is a widely used monitoring and analysis tool, into the Apache APISIX monitoring suite.
Introducing Apache APISIX
Apache APISIX is a dynamic, real-time, high-performance API gateway that provides load balancing, dynamic upstream, canary release, fine-grained routing, rate limiting, service degradation, circuit breaking, authentication, observability, and hundreds of other features. In addition, the gateway supports dynamic plugin changes along with hot-loading. Apache APISIX can be used to proxy traditional NORTH-SOUTH traffic, as well as EAST-WEST traffic between services, or as a k8s ingress controller. The datadog plugin for Apache APISIX allows users to export valuable metrics to DatadogHQ to have a holistic lookup along with the intricate details of the microservice mesh.
Introducing Datadog
Datadog is a Cloud Monitoring as a Service solution for observability in cloud-scale applications providing monitoring of servers, databases, tools, and services, through a SaaS-based data analytics platform. As of Q1-2021 (source), more than 15,000 customers uses Datadog for distributed monitoring and security.
Demystifying Observability & Monitoring
In software, Observability refers to the telemetry produced by services. There are three pillars of observability - Logs, Metrics, and Traces. While Monitoring refers to collecting, processing, aggregating, and displaying real-time quantitative data about a system, such as query counts and types, error counts and types, processing times, and server lifetimes. In general, what we know by monitoring is actually Whitebox-Monitoring which is the monitoring based on the metrics exposed by the internals of the system. We often do consult a dashboard (usually a web UI) that provides the summary view of the service's core metrics. Monitoring is crucial for analyzing long term trends, alerting and building dashboards. In a nutshell, Observability is achieved when data/useful information is collected from the system that you wish to monitor and monitoring is the actual task of collecting and displaying the data.
About APISIX-Datadog Plugin
The datadog plugin pushes its custom metrics to the DogStatsD server, comes bundled with Datadog agent over the UDP connection. DogStatsD basically is an implementation of StatsD protocol which collects the custom metrics for Apache APISIX agent, aggregates it into a single data point and sends it to the configured Datadog server. To learn more about DogStatsD, please visit DogStatsD documentation.
Apache APISIX agent exports the following metrics to DogStatsD server for every request response cycle, if the datadog plugin is enabled:
| Metric Name | StatsD Type | Description |
|---|---|---|
| Request Counter | Counter | No of requests received. |
| Request Latency | Histogram | Time taken to process the request (in milliseconds). |
| Upstream latency | Histogram | Time taken since proxying the request to the upstream server till a response is received (in milliseconds). |
| APISIX Latency | Histogram | Time taken by APISIX agent to process the request (in milliseconds). |
| Ingress Size | Timer | Request body size in bytes. |
| Egress Size | Timer | Response body size in bytes. |
The metrics will be sent to the DogStatsD agent with the following tags. If there is no suitable value for any particular tag, the tag will simply be omitted.
- route_name: Name specified in the route schema definition. If not present, it will fall back to the route id value.
- service_id: If a route has been created with the abstraction of service, the particular service id will be used.
- consumer: If the route has a linked consumer, the consumer Username will be added as a tag.
- balancer_ip: IP of the Upstream balancer that has processed the current request.
- response_status: HTTP response status code.
- scheme: Scheme that has been used to make the request, such as HTTP, gRPC, gRPCs etc.
The plugin maintains a buffer with a timer. Periodically, when the timer expires, it flashes the buffered metrics as a batch to the locally run dogstatsd server. This approach is less resource-hungry (though it might be insignificant as UDP sockets are very lightweight) by reusing the same UDP socket and doesn't overload the network all the time as the timer can be configured.
Metrics Flow View


Steps to Run Datadog Agent
- If you are already using Datadog inside your infrastructure, you must have a datadog agent installed in your systems. It may either be a docker container, pod or binary for a respective package manager. In this case, you are good to go. Just make sure port
8125/udpis allowed through the firewall (if any) i.e more specifically, the Apache APISIX agent can reach port 8125 of the datadog agent. You may skip this subsection.
To learn more about how to install a full-fledged datadog agent, visit here.
-
If you are new to Datadog
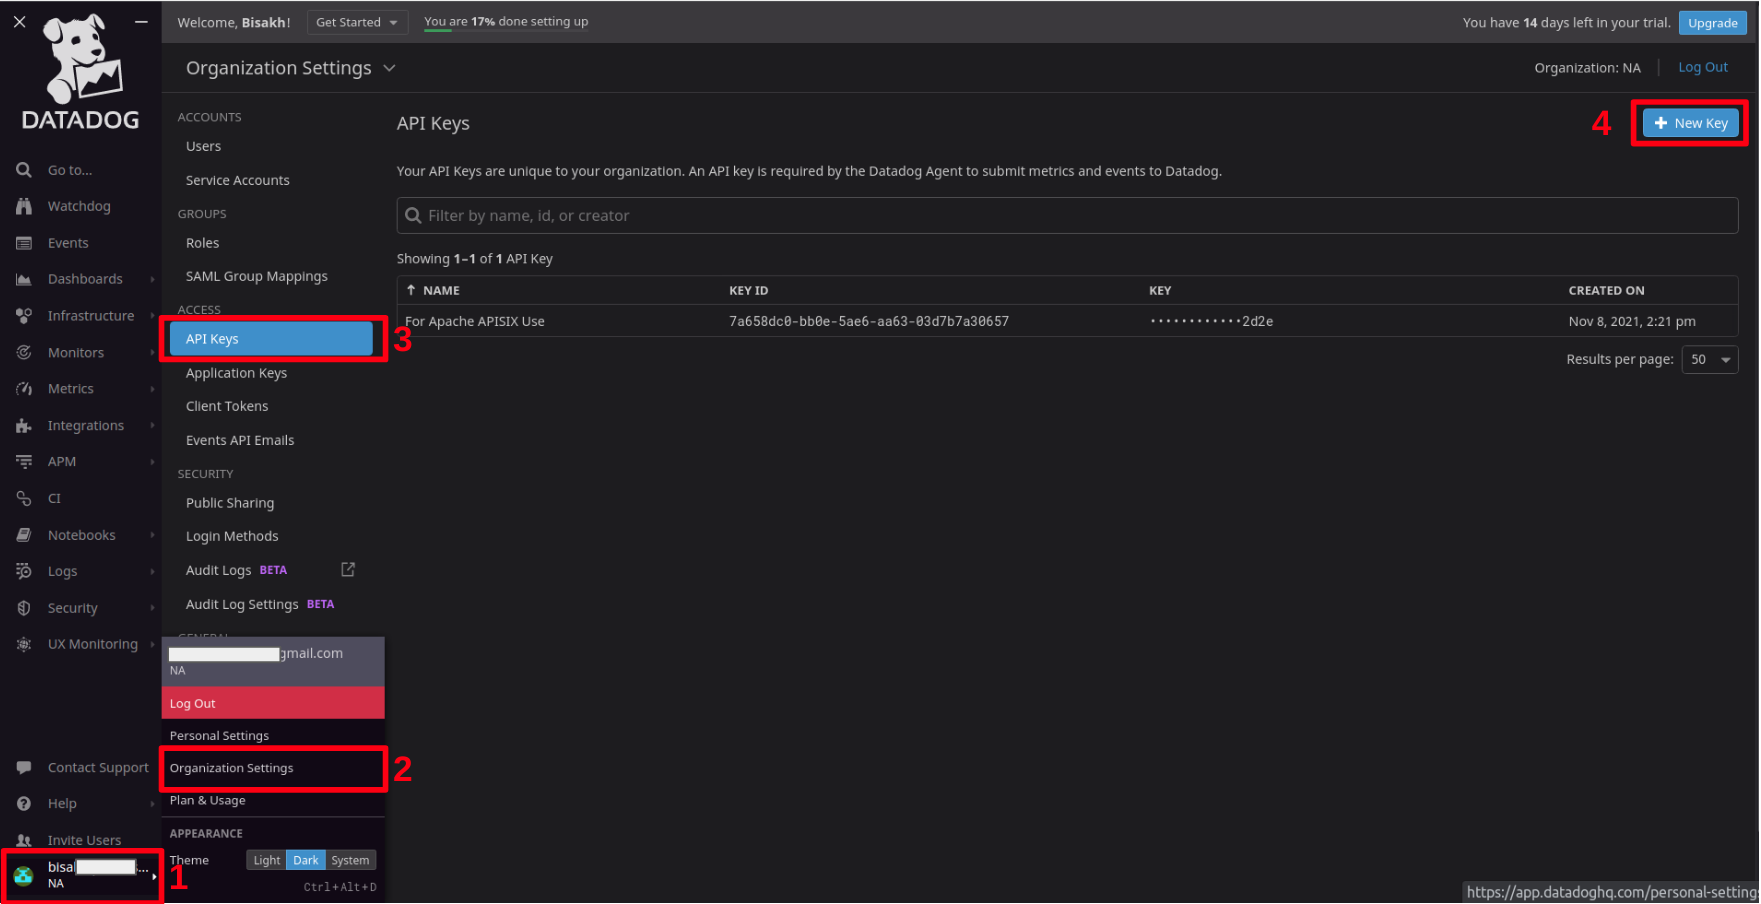
a. First, create an account by visiting www.datadoghq.com.
b. Generate an API Key following the steps demonstrated below -
Apache APISIX datadog plugin requires only the
dogstatsdcomponent ofdatadog/agentas the plugin asynchronously send metrics to the dogstatsd server following the statsd protocol over standard UDP socket. That's why APISIX recommends using the standalonedatadog/dogstatsdimage (link) instead of using the full agent. It's extremely lightweight (only ~11 MB in size) compared to ~2.8GB ofdatadog/agentimage.

To run it as a container,
# pull the latest imagedocker pull datadog/dogstatsd:latest# run a detached containerdocker run -d --name dogstatsd-agent -e DD_API_KEY=<Your API Key from step 2> -p 8125:8125/udp datadog/dogstatsdAlso, if you using Kubernetes in your production environment, you can deploy dogstatsd as a Daemonset or as a Multi-Container Pod alongside Apache APISIX agent.
How to Use
The following is an example of how to enable the datadog plugin for a specific route. We are assuming your dogstatsd agent is already up and running.
# enable plugin for a specific routecurl http://127.0.0.1:9080/apisix/admin/routes/1 -H 'X-API-KEY: edd1c9f034335f136f87ad84b625c8f1' -X PUT -d '{ "plugins": { "datadog": {} }, "upstream": { "type": "roundrobin", "nodes": { "127.0.0.1:1980": 1 } }, "uri": "/hello"}'Now any requests to endpoint uri /hello will generate aforesaid metrics and push them to the local DogStatsD server of the datadog agent.
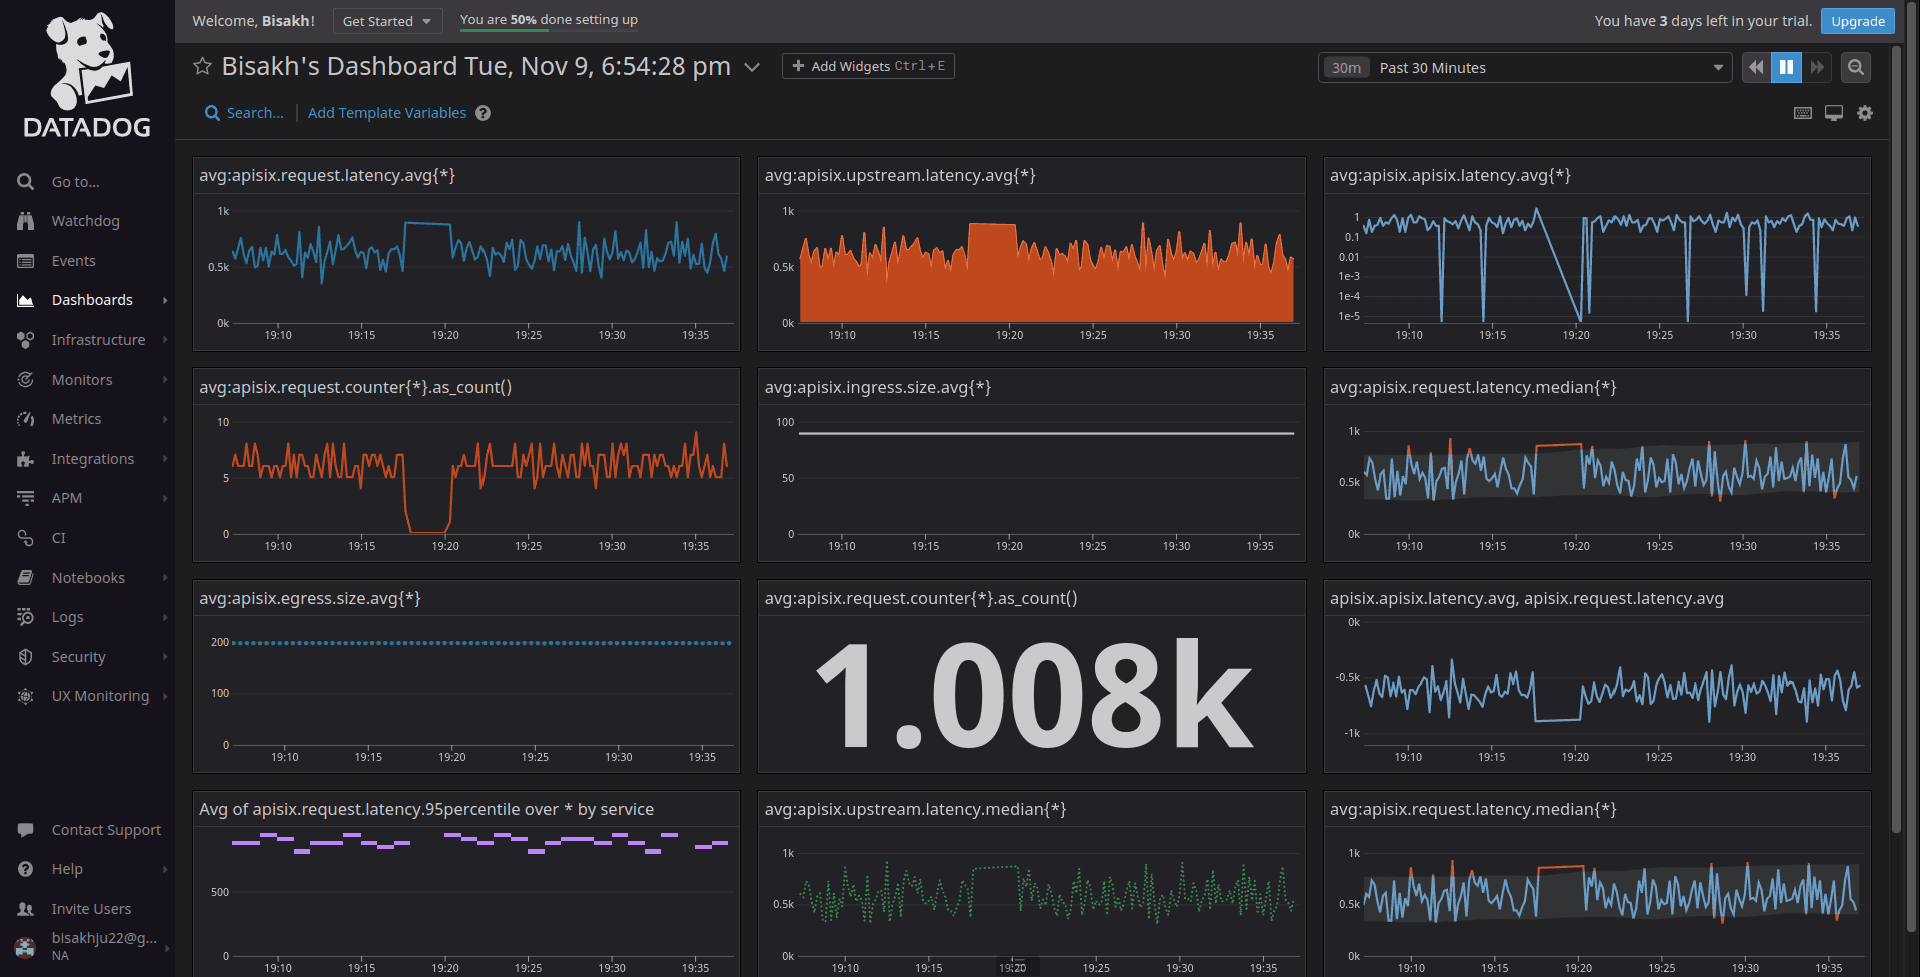
Now the result Dashboard at Datadog server:

Now, to disable the plugin simply remove the corresponding json configuration in the plugin configuration to disable the datadog.
APISIX plugins are hot-loaded, therefore there is no need to restart APISIX.
# disable plugin for a routecurl http://127.0.0.1:9080/apisix/admin/routes/1 -H 'X-API-KEY: edd1c9f034335f136f87ad84b625c8f1' -X PUT -d '{ "uri": "/hello", "plugins": {}, "upstream": { "type": "roundrobin", "nodes": { "127.0.0.1:1980": 1 } }}'Custom Configuration
In the default configuration, the plugin expects the dogstatsd service to be available at 127.0.0.1:8125. If you wish to update the config, please update the plugin metadata:
Metadata Schema
| Name | Type | Requirement | Default | Description |
|---|---|---|---|---|
| host | string | optional | "127.0.0.1" |
The DogStatsD server host address |
| port | integer | optional | 8125 |
The DogStatsD server host port |
| namespace | string | optional | "apisix" |
Prefix for all the custom metrics sent by APISIX agent. Useful for finding entities for metric graph. e.g. (apisix.request.counter) |
| constant_tags | array | optional | ["source:apisix"] |
Static tags embedded into generated metrics. Useful for grouping metric over certain signals. |
To know more about how to effectively write tags, please visit here
Make a request to /apisix/admin/plugin_metadata endpoint with the updated metadata as following:
$ curl http://127.0.0.1:9080/apisix/admin/plugin_metadata/datadog -H 'X-API-KEY: edd1c9f034335f136f87ad84b625c8f1' -X PUT -d '{ "host": "127.0.0.1", "port": 8125, "constant_tags": [ "source:apisix", "service:custom" ], "namespace": "apisix"}'Similarly there are a few attributes that can be tweaked while enabling the plugin.
Plugin Schema
| Name | Type | Requirement | Default | Valid | Description |
|---|---|---|---|---|---|
| batch_max_size | integer | optional | 5000 |
[1,...] | Max buffer size of each batch |
| inactive_timeout | integer | optional | 5 |
[1,...] | Maximum age in seconds when the buffer will be flushed if inactive |
| buffer_duration | integer | optional | 60 |
[1,...] | Maximum age in seconds of the oldest entry in a batch before the batch must be processed |
| max_retry_count | integer | optional | 1 |
[1,...] | Maximum number of retries if one entry fails to reach dogstatsd server |
As all the fields are optional and if no attributes are set, the datadog plugin gets instantiated with the default values. To update any attribute, just update the required route/service/consumer with the updated attribute value, for example:
'{..."plugins": { "datadog": { "batch_max_size": 10 }}... }'Related pull request
✅ PR#5372 feat(plugins): Datadog for metrics collection
✅ PR#5463 feat: introducing prefer_name attribute in datadog plugin
Thank You!
––– views